Universal Platform for Managing Data Life Cycle (Visualization and Knowledge Engineering) - GSoC2022

Description
For developing the universal platform and introducing it in DBpedia’s existing ecosystem, the last two years (GSoC 2020 and GSoC 2021) were about Proof of Concept (PoC) and building the foundations of the platform. In GSoC 2020, the dashboard for DBpedia was for summarizing the data statistics of the public endpoint. The SPARQL queries were referenced from the paper SPORTAL: Profiling the Content of Public SPARQL Endpoints. However, in GSoC 2021, several components were added to introduce more usability.

At present, the new platform for data and knowledge engineering includes following capabilities:

  1. User authentication with credentials same as databus.
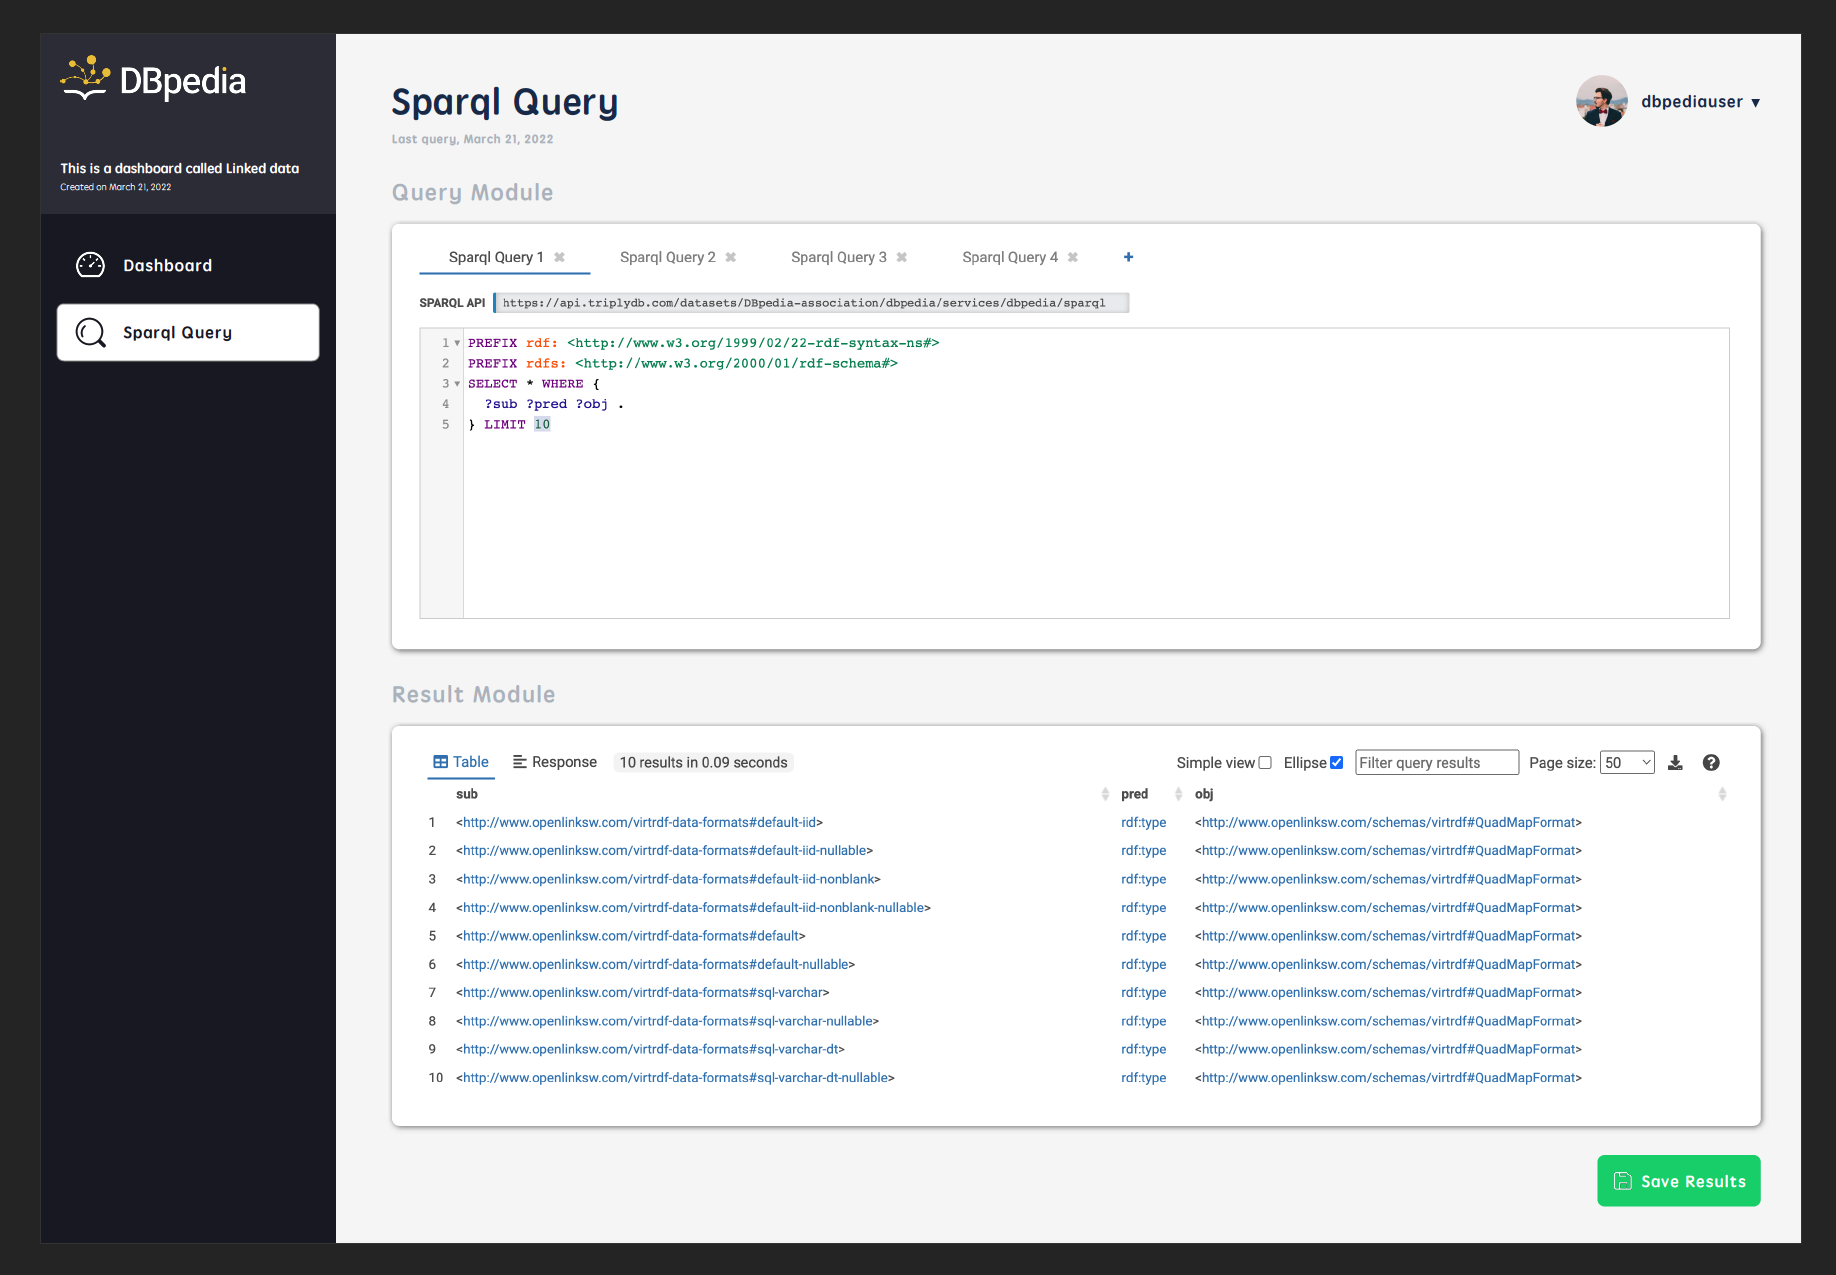
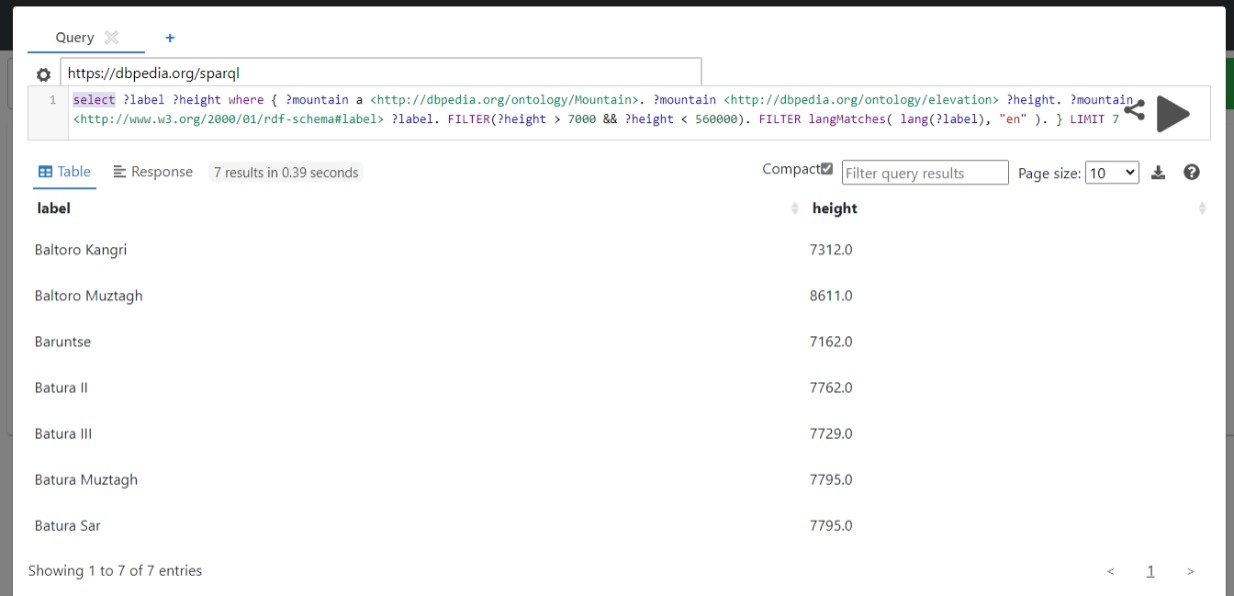
  2. Integrated web based SPARQL query editor YASQE on the platform that allows users to query different endpoints and save their results.
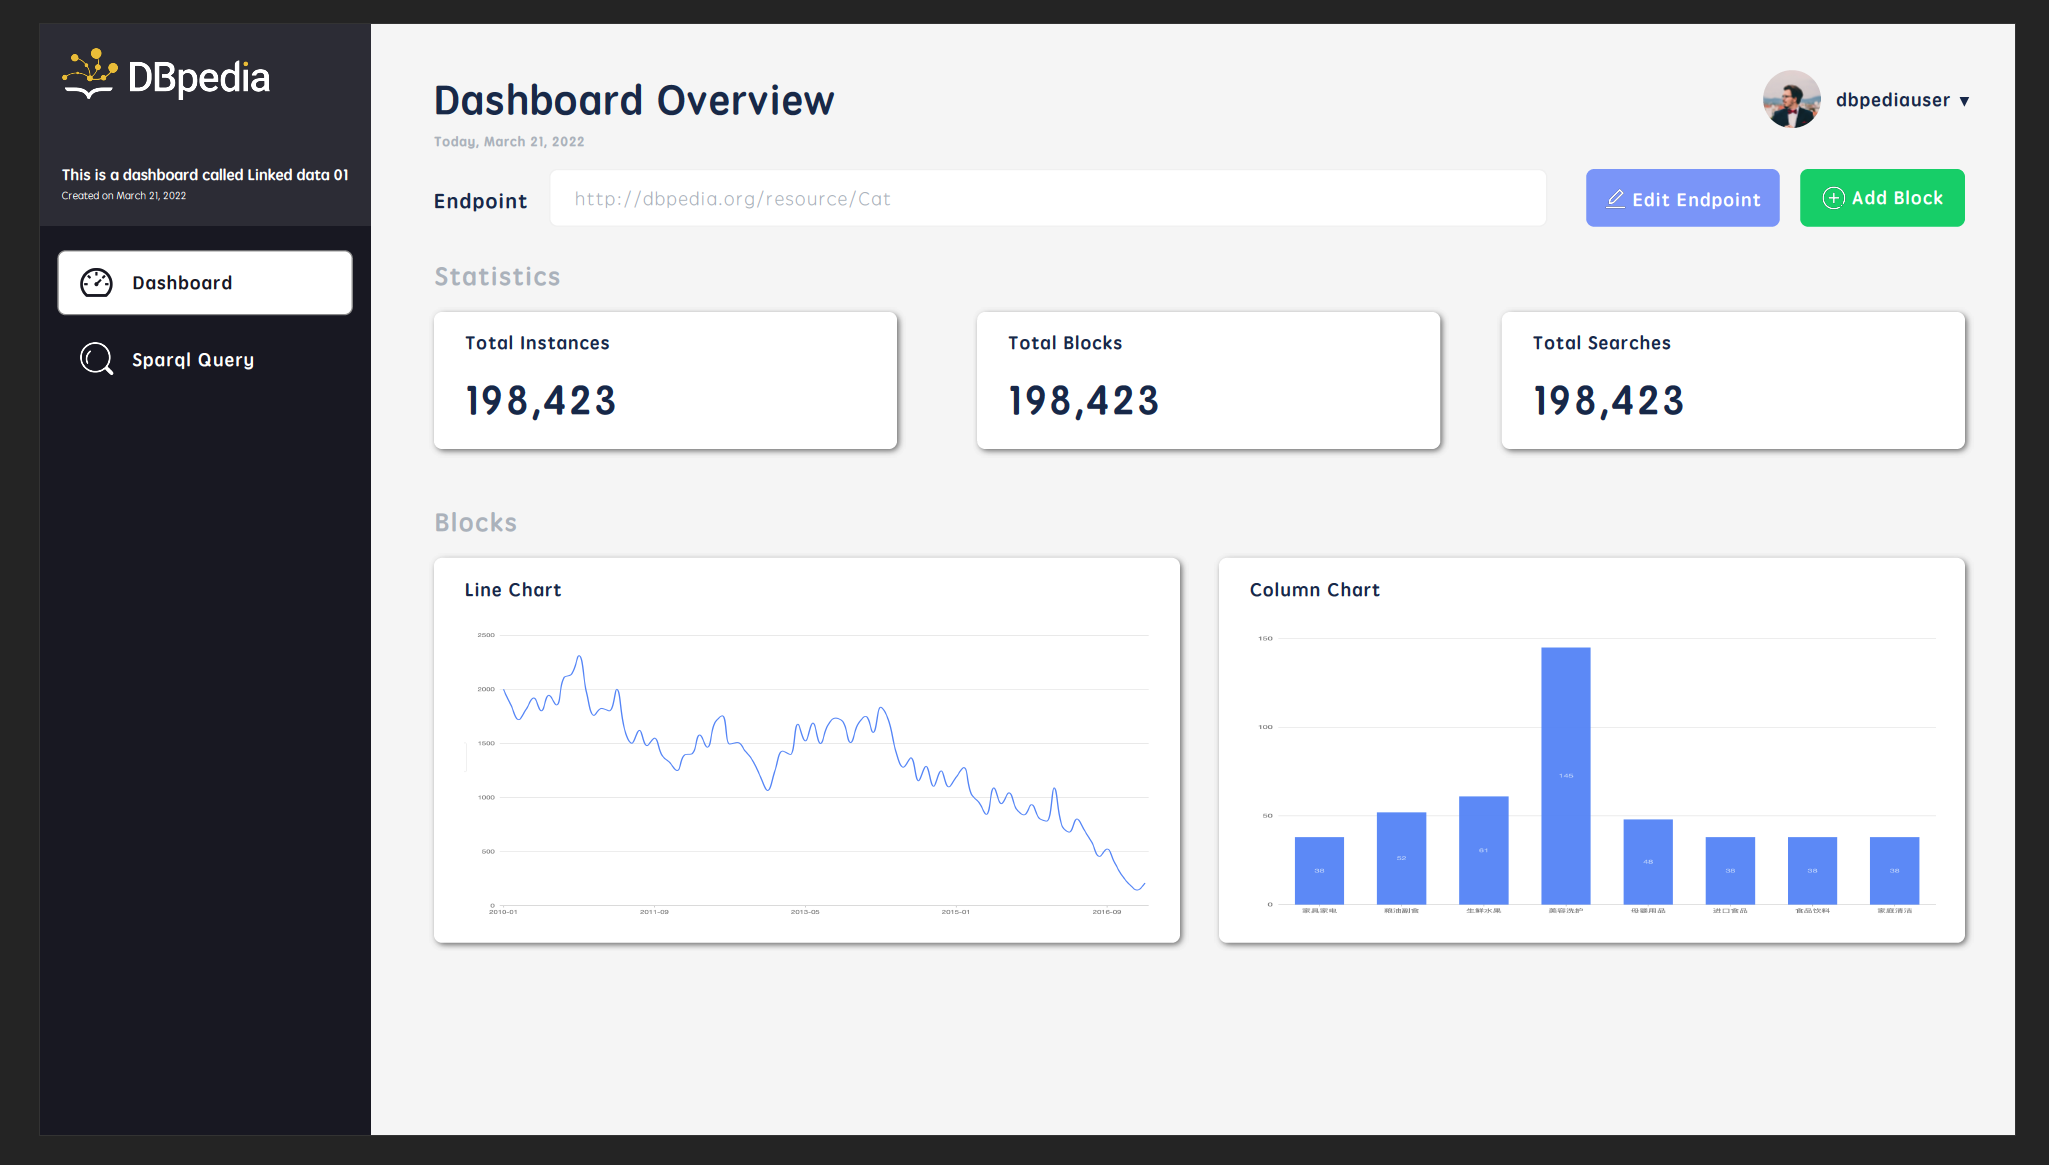
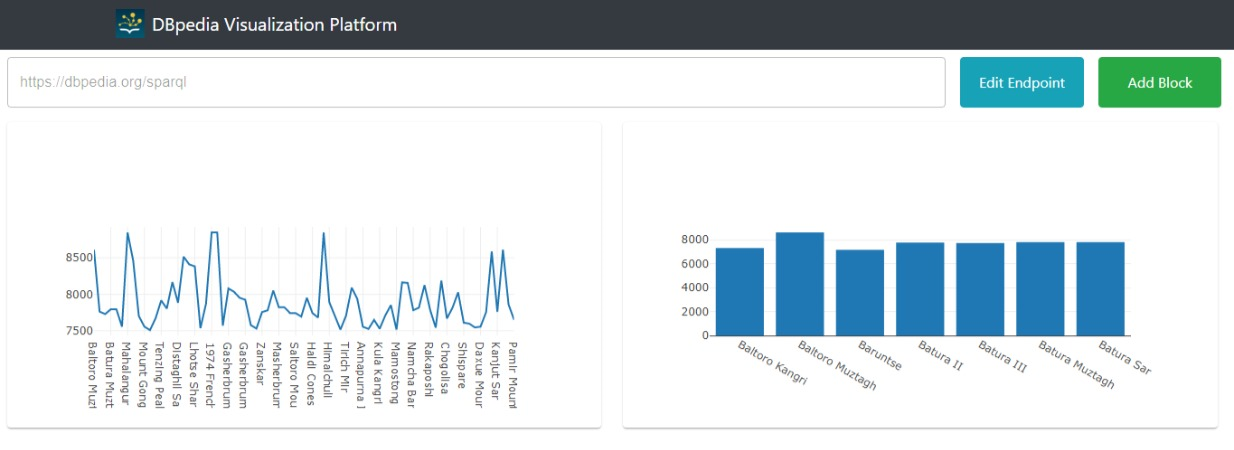
  3. Visualize query results (based on user selection: pie chart, line chart, bar chart, etc.) and add such multiple blocks on the blank canvas to publish it as a complete custom dashboard.
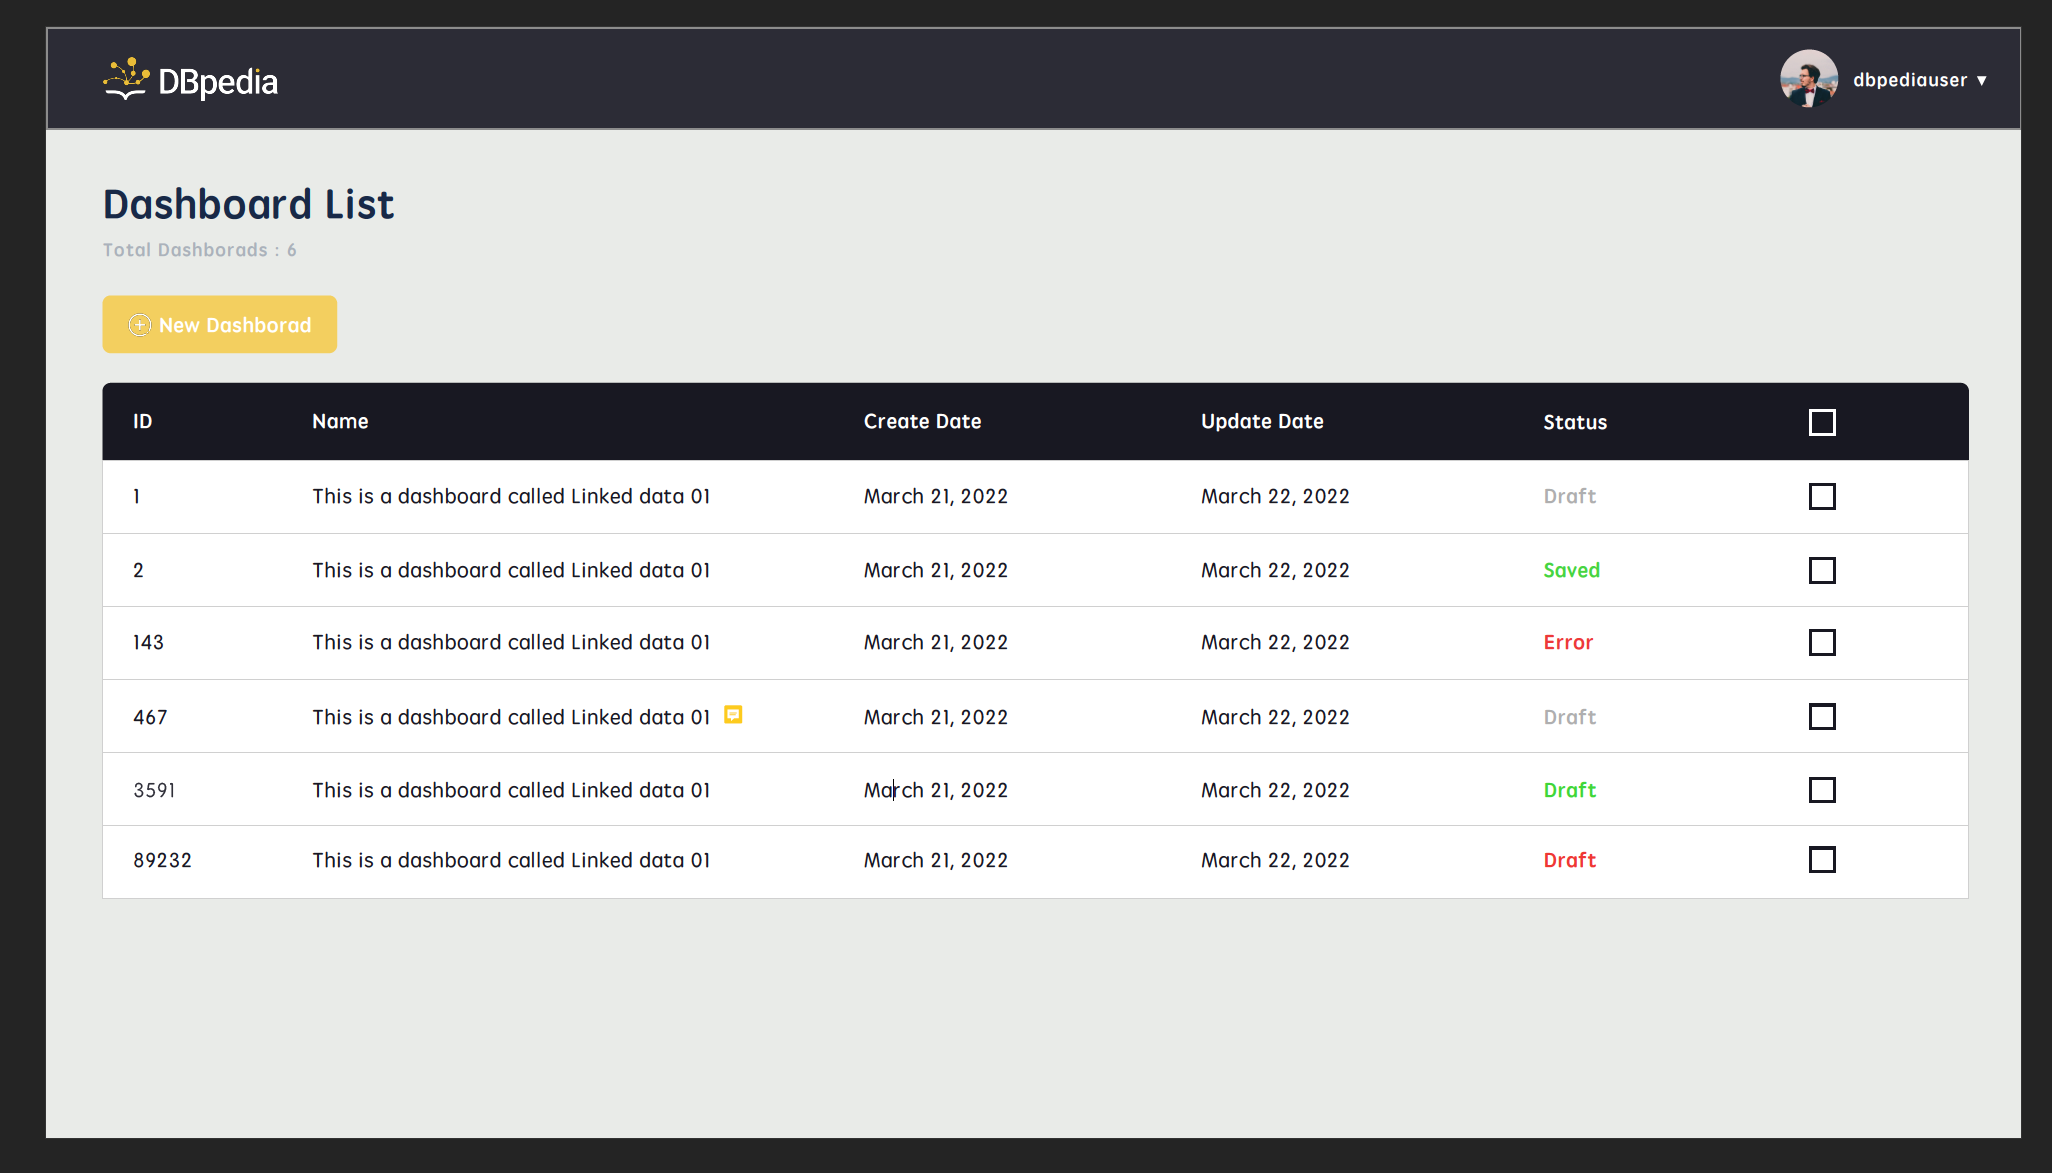
  4. Create, View, Update, and Delete dashboards and their internal blocks.

Few screenshots of current stage of project:


This year, the project is about stabilizing the existing functionalities, including fixing UI using ReactJS, and filling gaps in CRUD operations in MongoDB using Python web framework Flask. Additionally, for building blocks in dashboards, several components are used like YASQE, Plotly (for visualization), and Bootstrap. These components need to be tightly integrated to work efficiently. For visualization, introduce new graphs and options to change characteristics like color and size of blocks. Lastly, using docker, deploy the platform on DBpedia server.

Goal
The goal is to build an official staging area for small data transformation and visualization to perform analysis without leaving DBpedia’s ecosystem. The phases of data lifecycle includes fetching the data from user defined endpoints (multiple or single), apply aggregate functions, select visualization characteristics and lastly, publishing the results.

Impact

  1. User Retention: Users that rely on DBpedia’s data, are fetching by querying and lastly analyzing it on other platforms. With that being said, there is not much interaction between users and DBpedia’s knowledge graphs as processing is done completely outside of DBpedia which leaves DBpedia, just a data-hub. However, having this platform integrated in existing ecosystem will help users to manage as well as analyze their data without shifting away from DBpedia. With this, users can leverage all the support from the community in terms of data processing.

  2. Better Control Over Knowledge Graph Statistics: As users will query and filter the data to visualize it in their ways, it gives more flexibility for custom operations. Additionally, users will be able save their files (output of queries) in their buckets (folders) on the dashboard portal itself.

Warm-up tasks

  1. Getting familiar with Docker, ReactJS, and Flask (Python). Setting up the local environment of current project GSOC2021-DBpedia
    Note: Good to have DBpedia databus account registered.
  2. Spinning up docker containers locally.
  3. Setup local MongoDB container and include that as a part of docker-compose for the project.
  4. Getting started with redesigning login page.

Mentors
Jan Forberg
Karan Kharecha

Project size (175h or 350h)
350h

Keywords
docker, data engineering, knowledge graphs, user centric, user authentication, data visualization

Hello everyone,

My name is Weiyu Chen, and I am currently a student in artificial intelligence at King’s College London. I would like to contribute to DBPedia as a GSoC 22 student.

A brief background about me: I used to be a software development engineer at Tencent Technology (Shenzhen) Co., Ltd. and have rich experience in back-end development. I was responsible for the back-end development of Tencent Cloud Financial Services. My main programming language is Python and Java, good web development frameworks I used include Flask, Django and SpringBoot. My daily work requirement is to deploy all background services in a containerized form into a container cluster. In addition, I also have a lot of web front-end development experience. I have mastered front-end development frameworks including React and Vue, and I can also be familiar with some open source component libraries (such as Bootstrap).

During my university years, I have been working on knowledge graph related researches for a long time and have published the following publications:
[1] Chen W, Jiang Y, Wu H, Huang J, Luo S. Xiangshan Cultural Information Organization and Retrieval System Based on Knowledge Graph
[2] Pan, H., Jiang, Y., Chen, W., Long, L. Research on financial trend reasoning and forecasting based on Allegrograph
[3] W Chen, J Huang, S Luo, H Wu, Y Jiang. Research on Space-Time Evolution Model of Xiangshan Culture Knowledge Graph Based on Named Graph

In addition, I attach some representative development projects of mine (due to the confidential nature of my work, forgive me and I can only show some of my personal open source achievements), which is a knowledge graph Web search system based on SpringBoot+BootStrap (https:/ /github.com/weiyuchens/KGraph), which is a Python-based algorithm engineering project (https://github.com/weiyuchens/CValue)

I am very interested in the Universal Platform for Managing Data Life Cycle (Visualization and Knowledge Engineering) project, and I hope to contact the mentors to discuss a solution that can help this project achieve better results.

Looking forward to having a great time here.

Hi, I am Karan (one of the mentors for this project), thanks for the post. Your experience could be relevant for this project and surely we can discuss this further. However, I have few questions before we discuss:

  1. Have you gone through the current code (i.e., the basic foundations of the system)?. The code is quite simple and since you have experience in frontend, backend, and docker containers, it would be easy for you to get familiar with the code.
  2. It would be better as well if you could clone the repository, create your branch, and start with the warm tasks. Have you started these tasks?

Hi Karan,

Thank you for your reply.

I had cloned the project repository a few days ago and successfully ran it through the docker container. In addition, the MongoDB container was also started, and a database named DBpedia was created and connected. Currently, I’m setting up a local MongoDB container and trying to add it as part of the GSoC-DBpedia-dashboard project’s docker-compose.yml.

However, I haven’t created a branch on the git repository, and the work mentioned above is currently only working locally. This week, I will create a new branch and start pushing the project progress synchronously.

Furthermore, when I complete the above work, I hope further to design the existing front-end pages and Web API to help the system achieve better results.

I am looking forward to furthering comminicate.

I would also suggest to start preparing the proposal, if you want feedback at earlier stage.

Hi Karan,

I am preparing for the proposal. I have a few questions about the project and would like to communicate with you further.

My question is mainly divided into two modules, the first module is about requirements, and the second module is about technology.

First, about the requirements module. Among the goals proposed in the idea, the requirements I see include 2 points:

  • Fix UI with ReactJS
  • Use the Python web framework Flask to fill the gap of CRUD operations in MongoDB

I would like to further refine the details of the requirements, including:

  • Redesign the existing system pages to make the interaction look more friendly through some flat designs. I currently design some UI design pages as follows:


  • Use ReactJS and some component libraries of React to optimize the existing UI to achieve the above design effects. The UI component library currently planned to be used Ant Design (https://ant.design/), an out-of-the-box high-quality React component, as well as visual charts, and plans to use the data visualization chart library provided by the Ant team——AntV, based on React (https://antv.vision/en), by the way, it is also derived from the Ant Design design system. It uses these component libraries to enrich your visualization’s icon options.

Secondly, regarding the technical module, I browsed the existing code and currently think that there are roughly the following points that can be improved:

  • In the design of the API interface in the background, currently, only POST requests are used for data operations on the front and back ends. However, as a project that separates the front-end and back-end, I think it would be better to use the RESTful API design style to improve the existing API requests;

  • On the front-end interface request to the back-end, I think it is possible to encapsulate operations such as errors, logic and verification in a unified manner because this can reduce the redundancy of the code and improve the readability of the code;

  • In the CRUD operation of MongoDB, I think it may not be an excellent choice to write all the operation commands in the code. I will extract the part of the operation on the MongoDB database as a Model and use the ODM (Object Document Mapping) device) to operate on all data. Like MongoEngine.

By the way, I have questions about login page design and MongoDB. The first question is, the current login page after starting the service is the same as the databus login page. Do I need to redesign a new login page and keep it consistent with the latest version of the UI? However, the function will ensure that the same credentials as databus are used for user authentication. The second question is whether we need to include a visual management tool for MongoDB, such as adminMongo, in the project. When the user starts the project using the docker configuration file, it is automatically created together as a container node, convenient for data management. What do you think about this?

image

These are my questions and some ideas. I am looking forward to your guidance.

In addition, I have fork the project to my github repository (https://github.com/weiyuchens/gsoc-dbpedia-dashboard), and started working step by step.

Hi,

There are 2 more features to include. The things that you did till date are kind of warm up tasks. The real features are about making this platform more robust and usable. For example, improving visualization features. At present, there aren’t any flexibilities for users to change colors, fonts sizes, etc. (i.e., customizing the charts/graphs) and on the other hand, there is a need to include different types of visualization other than just line, bar, and pie charts.

Apart from these two features, we also want functionality to publicly share the dashboard. For example, user can design the dashboard and publish it (by getting universally unique link using which other users can access it) and in the same way, share the dashboard with specific list of users. This also includes forming teams/groups that can work on shared dashboard.

Lastly, we need more efficiency in terms fetching the data because the knowledge graphs are quite large and hence, some queries take longer to return the data.

These are the some of the important features that we expect to have on this project.
If you have started with the proposal, please share it with us so that we have start reviewing it and according you can improve your proposal (i.e., make changes, if required).

Best,
Karan

Hi Karan,

I’ve got a rough idea of the features that need to be designed and implemented.

I would like to ask if you can provide your email address so that I can send or share some things with you, such as proposal documents.

Best,
Weiyu

Hi,
Do you use Slack?
Are you a member of DBpedia workspace?

The Widespread Stage for Overseeing the Information Life Cycle, zeroing in on Representation and Information Designing, is a strong task with expansive ramifications. Such a stage plans to smooth out the administration of information from initiation to its different stages, including capacity, examination, representation, and use. A critical undertaking can reform how associations handle their information, guaranteeing proficiency, openness, and informed navigation.

Inside the setting of GSoC 2022 (Google Summer of Code), taking part in this task offers a remarkable chance to add to a state-of-the-art stage. As a GSoC member, you could participate in errands, for example, creating information representation modules, improving UIs, carrying out information designing calculations, or enhancing information stockpiling systems. Average cost of logo design 2022 can vary significantly based on several factors, including the designer’s experience, the complexity of the design, geographic location, and the specific requirements of the project. The key is to find a balance between quality and affordability that suits the project’s needs.